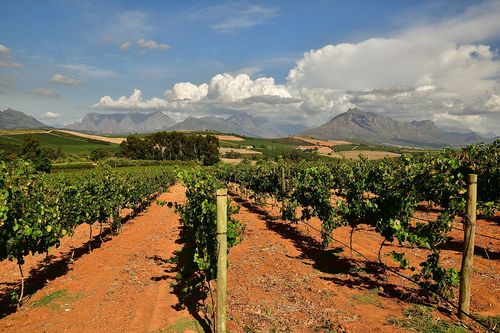
Central Otago
New Zealand · Oct 2024–Apr 2025
Much warmer
- Heat
- 1,210 GDD +38%
- Season rain
- 314 mm -11%
- Harvest rain
- 85 mm -6%
Hot months: Dec +2.6° Feb +3.4° Mar +2.4° Apr +2.4°
Rank 3 of 26 for heat · Winkler I
Vintage weather · 41 regions · 2000–2025
How warm was the growing season, how much rain fell, and did it pour at harvest? Every figure here is computed from climate data for each year and compared with the region's own 1991–2020 normal.
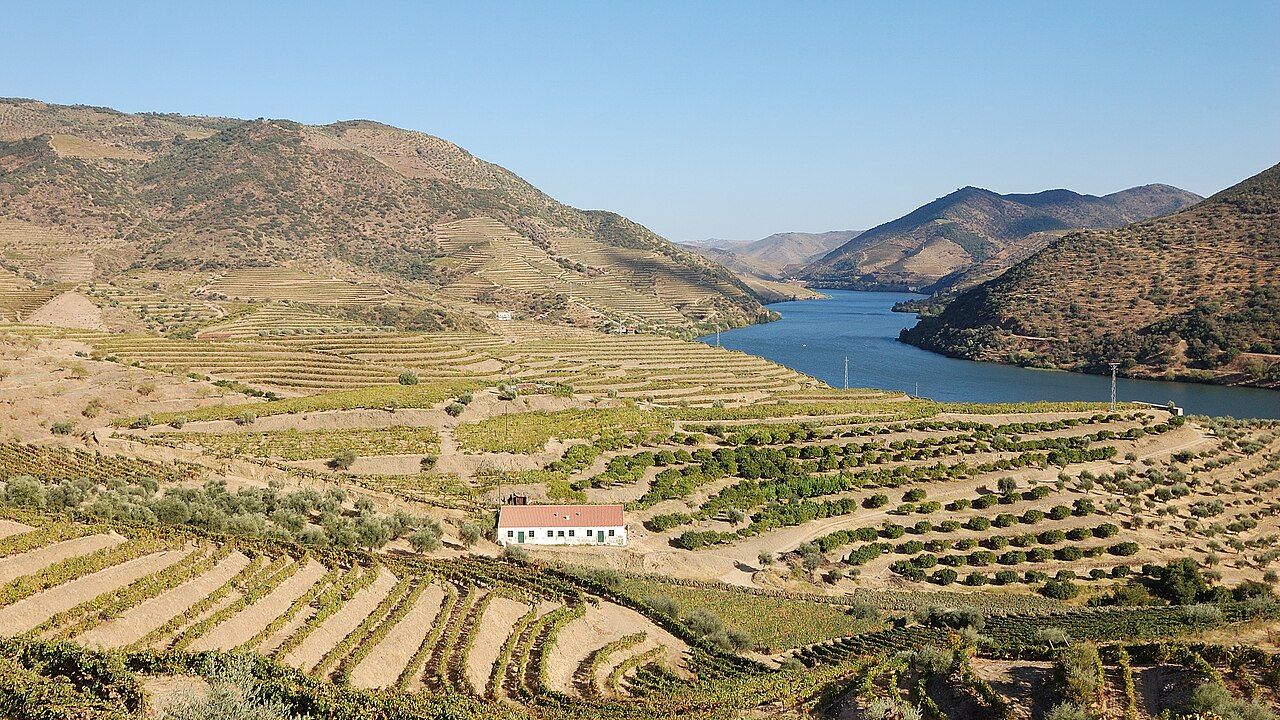
Photo: Rosino, CC BY-SA 2.0, via Wikimedia Commons · Douro Valley
Grapevines grow when it is warmer than about 10°C. Add up how far each day's mean temperature sat above that line through the growing season and you get growing degree days (GDD), the measure viticulturists have used since Amerine and Winkler mapped California's vineyards in 1944. Cool regions such as the Mosel or Champagne collect around 1,100–1,200; Jerez and the Hunter Valley more than twice that.
A season that runs far above its region's normal pushes ripening early, and one far below can struggle to ripen at all. Rain in the weeks before picking brings rot and dilution. This site shows those numbers for each vintage, and nothing more. It is not a quality rating.
Europe, enlarged
Where the name comes from
Eight of the regions here are French, from Champagne, the coolest, to the Languedoc. Each page shows every vintage since 2000 against the region's own normal, and links to a French-language guide to visiting it on our sister site, Vivez joyeux: the name pair comes from a 1933 French poster, as the about page explains.
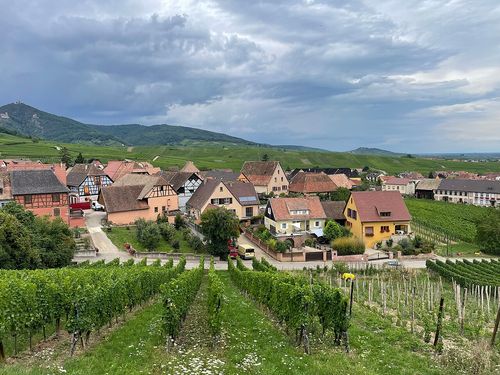
France · Winkler I · 1,360 GDD

France · Winkler II · 1,560 GDD
France · Winkler II · 1,410 GDD
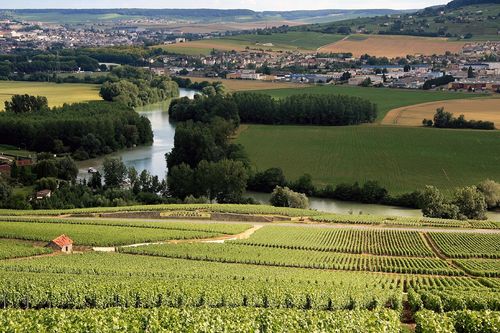
France · Winkler I · 1,180 GDD
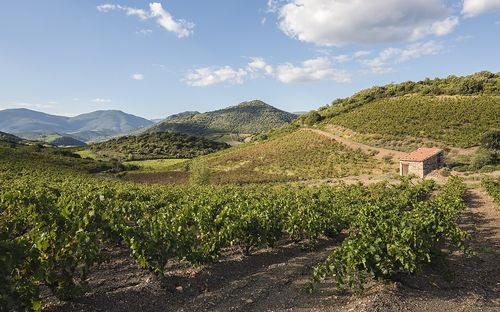
France · Winkler IV · 2,050 GDD
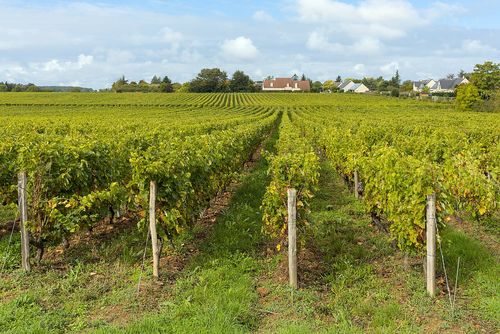
France · Winkler I · 1,380 GDD
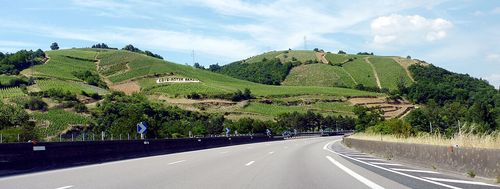
France · Winkler III · 1,790 GDD
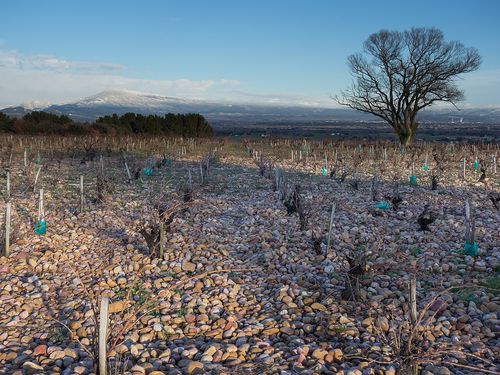
France · Winkler IV · 2,180 GDD
In 2025, 32 of 41 regions had a season more than 3% warmer than normal and 2 were more than 3% cooler. See every region's 2025 card →
New Zealand · Oct 2024–Apr 2025
Much warmer
Hot months: Dec +2.6° Feb +3.4° Mar +2.4° Apr +2.4°
Rank 3 of 26 for heat · Winkler I
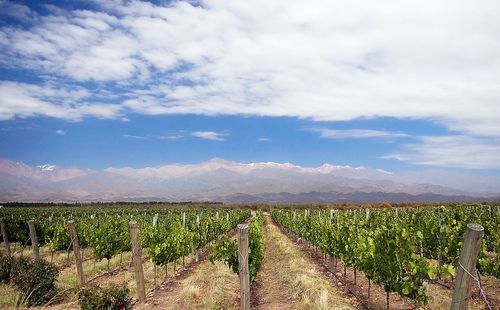
Australia · Oct 2024–Apr 2025
Much warmer
Hot months: Nov +2.0° Dec +2.0° Mar +2.9° Apr +2.5°
Rank 1 of 26 for heat · Winkler III
Australia · Oct 2024–Apr 2025
Much warmer
Hot months: Jan +2.1° Mar +3.2° Apr +2.6°
Rank 2 of 26 for heat · Winkler III
Spain
Much warmer
Hot months: Apr +2.0° Jun +5.3° Aug +3.7° Oct +2.7°
Rank 3 of 26 for heat · Winkler IV
Georgia
Near normal
No month ran 2°C above its normal high
Rank 18 of 26 for heat · Winkler IV
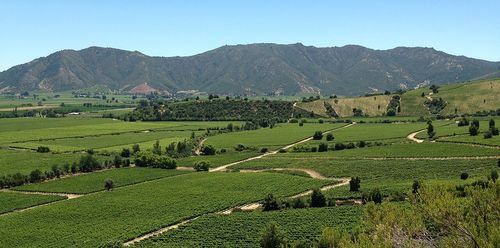
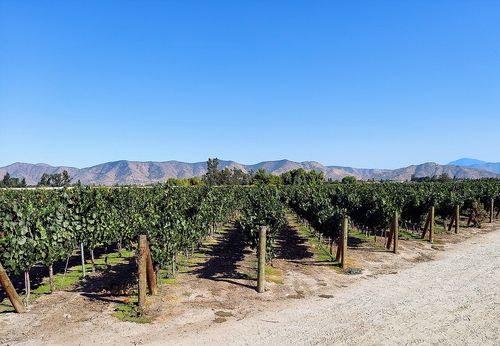
Chile · Oct 2024–Apr 2025
Near normal
No month ran 2°C above its normal high
Rank 9 of 26 for heat · Winkler III
United States
Cooler
No month ran 2°C above its normal high
Rank 21 of 26 for heat · Winkler III
Hungary
Much cooler
Hot months: Jun +2.2°
Rank 24 of 26 for heat · Winkler I
France · Winkler I · 1,360 GDD
France · Winkler II · 1,560 GDD
France · Winkler II · 1,410 GDD
France · Winkler I · 1,180 GDD
France · Winkler IV · 2,050 GDD
France · Winkler I · 1,380 GDD
France · Winkler III · 1,790 GDD
France · Winkler IV · 2,180 GDD
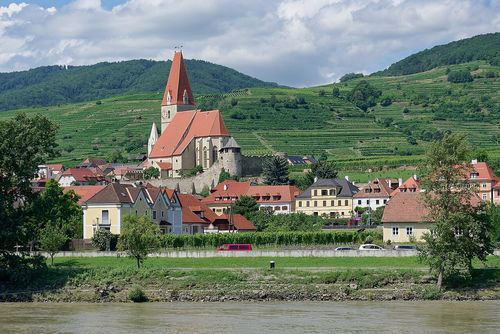
Austria · Winkler I · 970 GDD
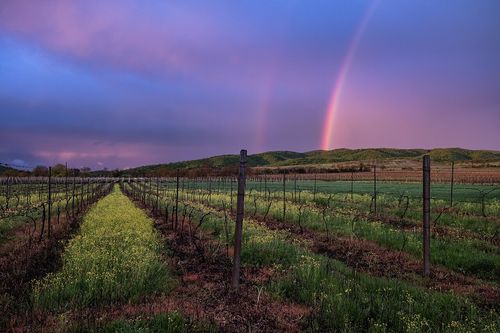
Georgia · Winkler IV · 2,090 GDD
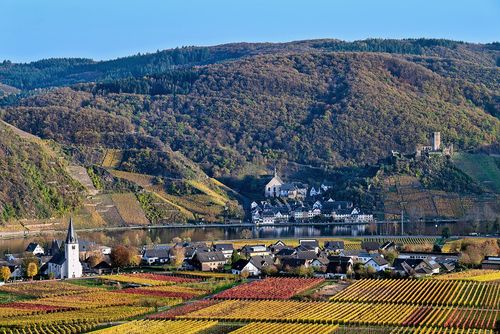
Germany · Winkler I · 1,060 GDD
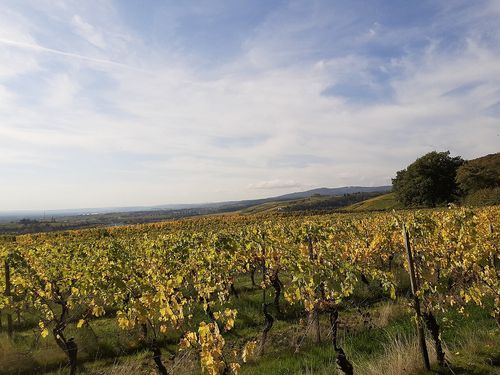
Germany · Winkler I · 1,140 GDD
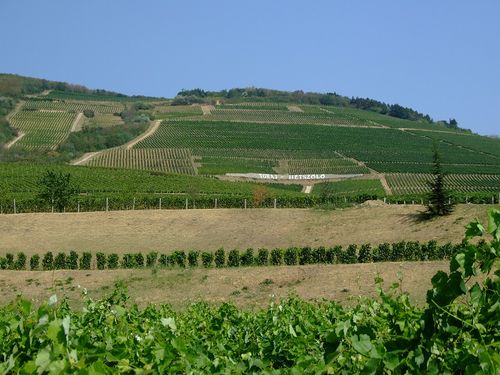
Hungary · Winkler II · 1,450 GDD
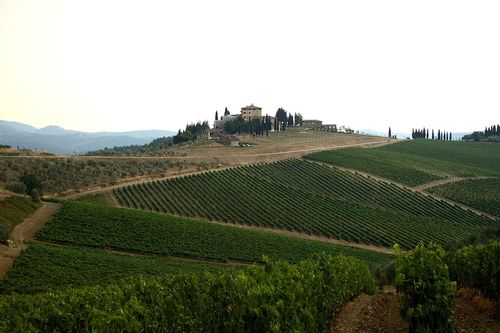
Italy · Winkler III · 1,730 GDD
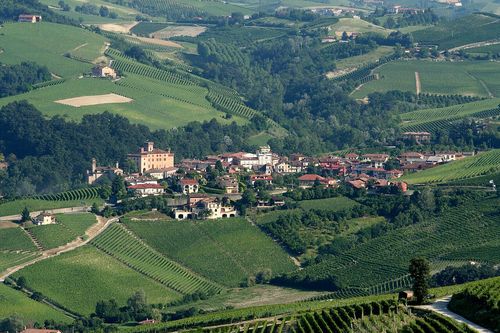
Italy · Winkler IV · 1,950 GDD
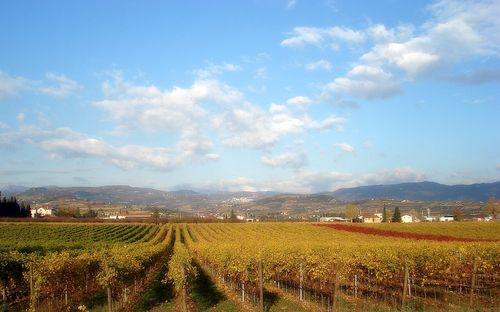
Italy · Winkler IV · 2,030 GDD
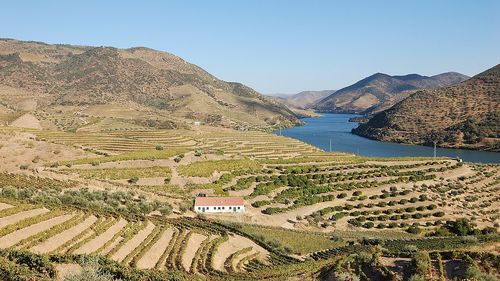
Portugal · Winkler II · 1,650 GDD
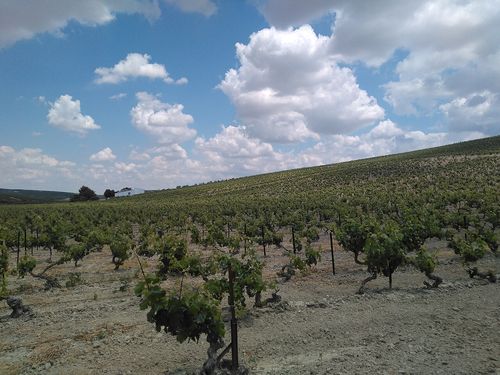
Spain · Winkler V · 2,610 GDD
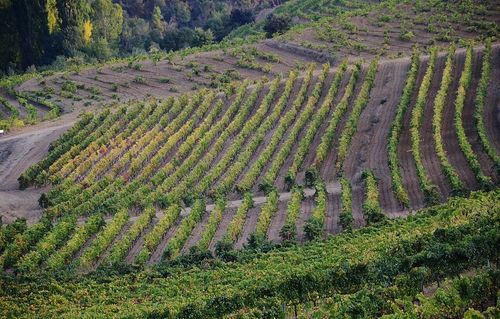
Spain · Winkler IV · 2,210 GDD

Spain · Winkler II · 1,610 GDD
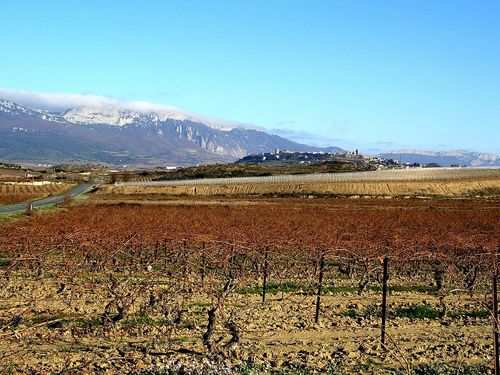
Spain · Winkler III · 1,700 GDD
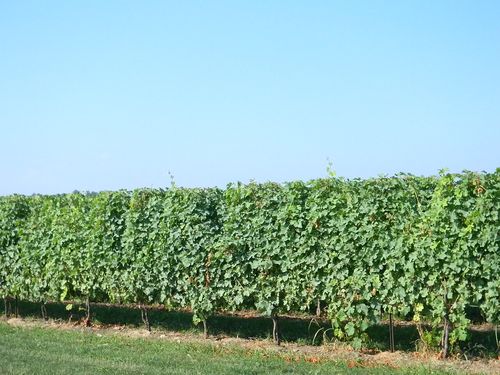
Canada · Winkler II · 1,410 GDD
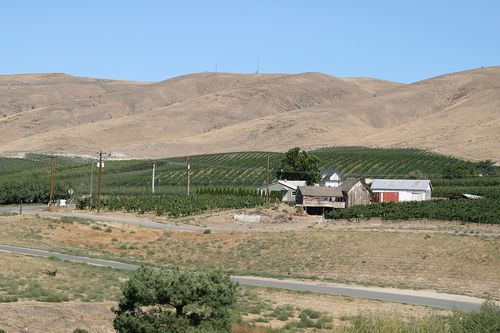
United States · Winkler II · 1,590 GDD

United States · Winkler I · 1,350 GDD
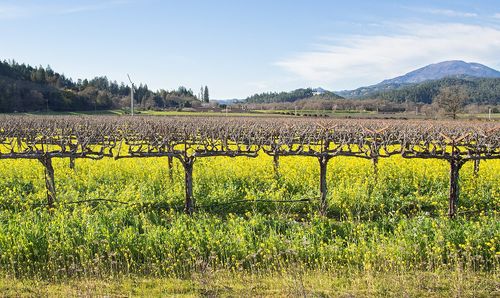
United States · Winkler III · 1,930 GDD

United States · Winkler III · 1,900 GDD

United States · Winkler III · 1,800 GDD
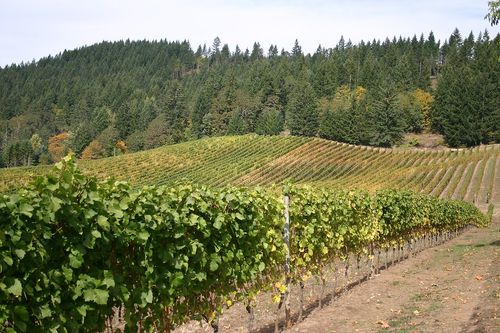
United States · Winkler I · 1,230 GDD
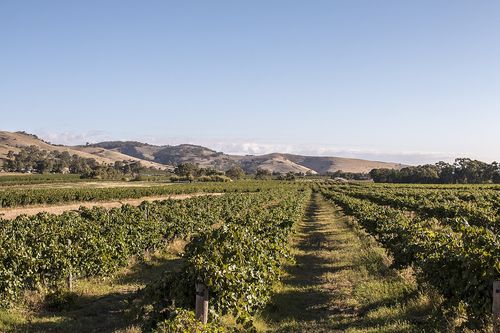
Australia · Winkler III · 1,870 GDD
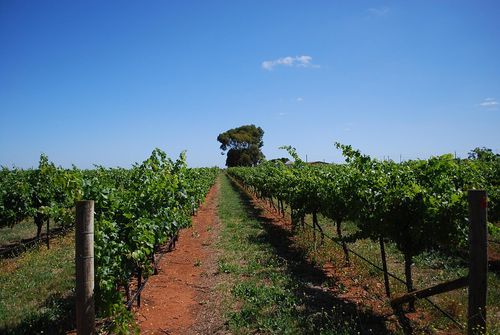
Australia · Winkler II · 1,480 GDD
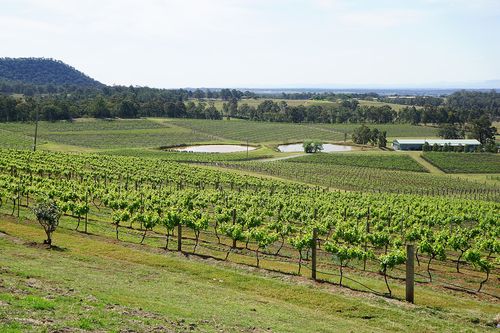
Australia · Winkler V · 2,380 GDD

Australia · Winkler III · 1,920 GDD
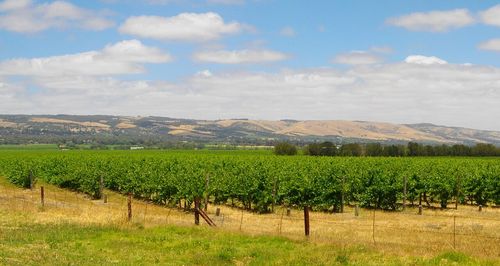
Australia · Winkler III · 1,900 GDD
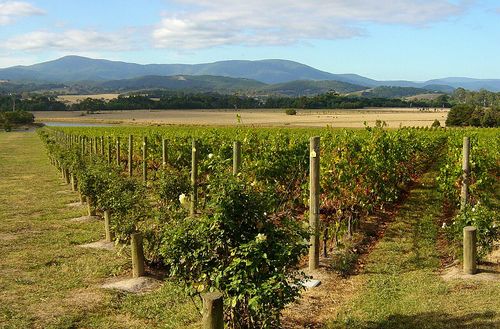
Australia · Winkler II · 1,560 GDD
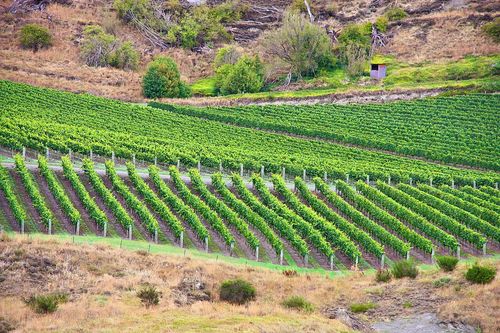
New Zealand · Winkler I · 880 GDD
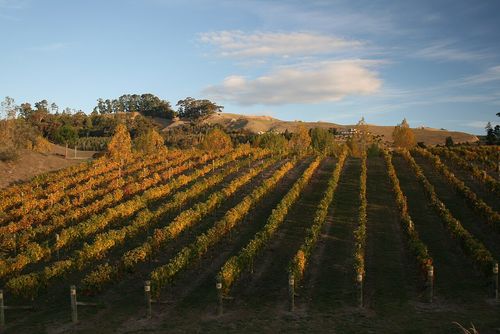
New Zealand · Winkler II · 1,440 GDD
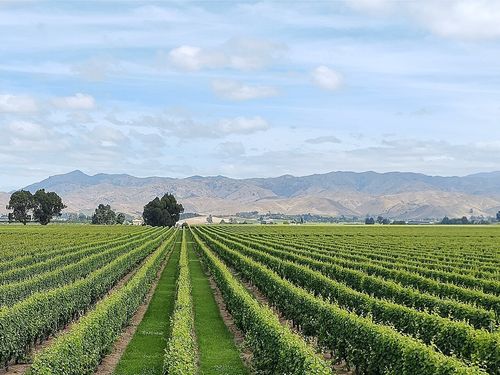
New Zealand · Winkler I · 1,240 GDD
Each grape page plots the regions that grow it on the heat scale.